HYDRAULIC RADIUS MODEL (HRM)
Introduction
Dempers & Seymour has extended the application of the Mining Rock Mass Model (MRMM) to create the 3D Hydraulic Radius Model which is used for underground stope design and ground support requirements.
The HR Model is calculated for the orebody and stope hangingwall, footwall and the backs based on the Stability Graph Method (Potvin 1988 & Nickson 1992) utilising rock mass parameters from the MRMM, stress condition, structure and stope and the orebody orientations in three dimensions.

HR Model Flow Chart
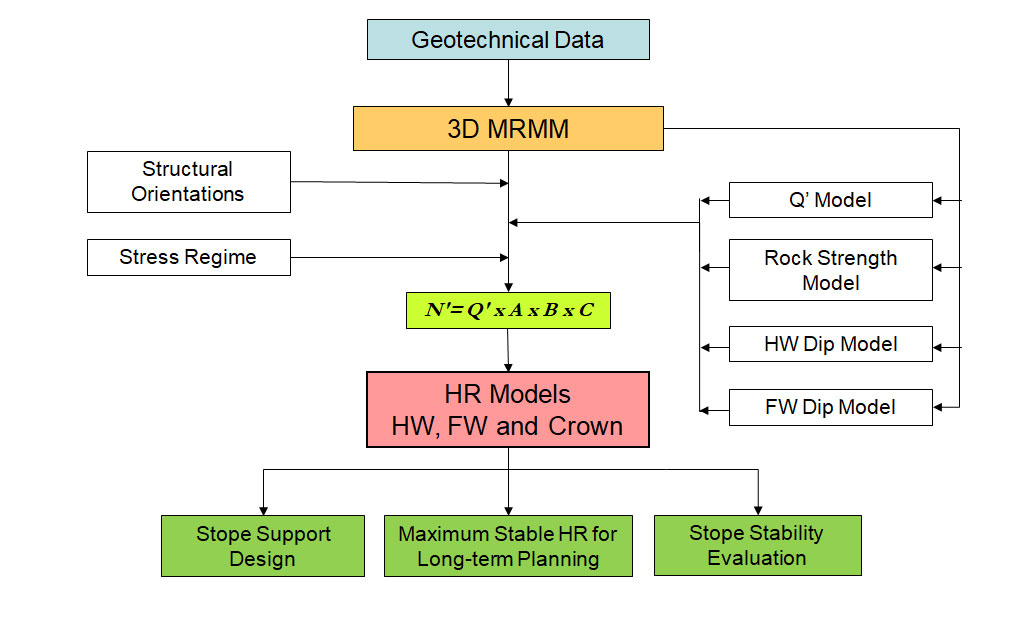
N’ Component Model
Modified Stability Number N’= Q’ x A x B x C
Parameters:
Q’ – Modified Q Tunnelling Quality Index
Factor A – Rock Stress
Factor B – Joint / Critical Structure Orientation Adjustment
Factor C – Gravity Adjustment
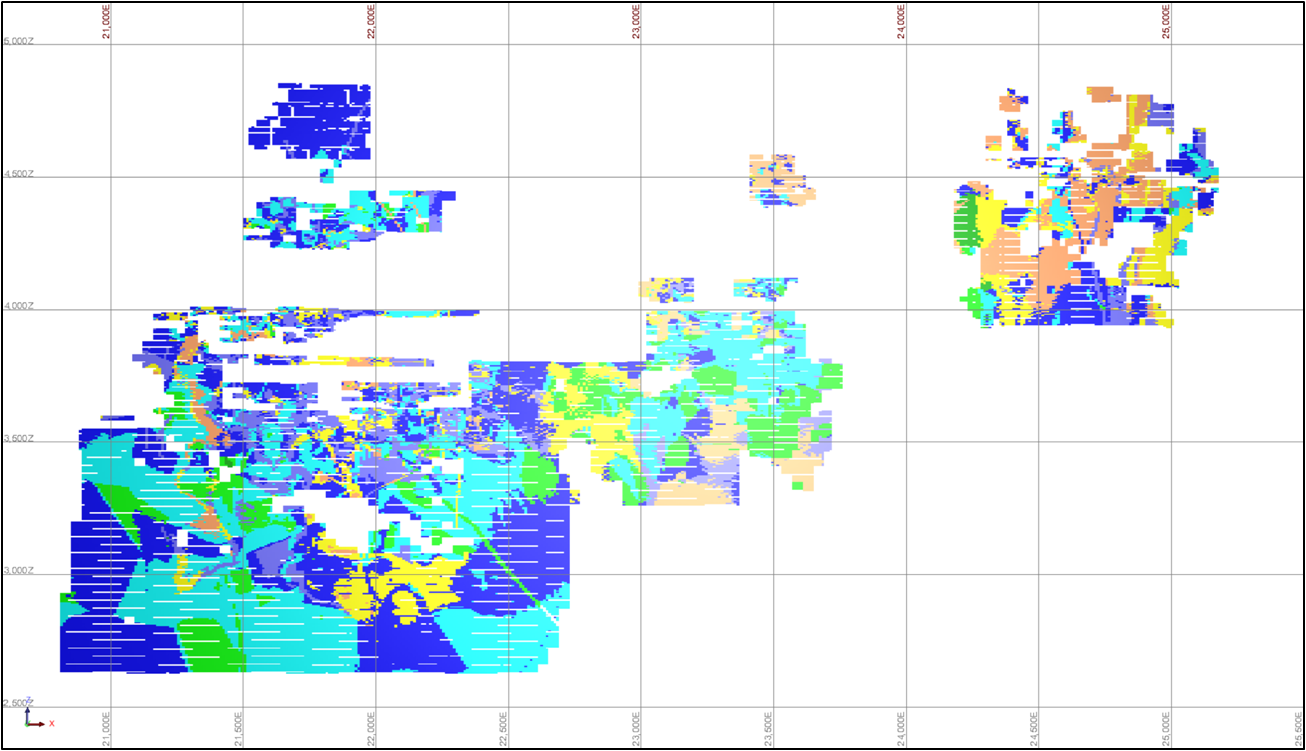
Q’ – MRMM Hangingwall Model

Long section view showing HW Q’ in stope area
Q’ – MRMM Footwall Model

Long section view showing FW Q’ in stope area

Stress Factor A – Stress Model
Factor A is determined using the 3D stress model (σmax) based on output from numerical stress modelling or induced stress determined from in-situ stress measurements together with rock strength (σc) from the MRMM.
Stress Factor A – Stress Model (HW and FW)
Long section view showing output from numerical stress modelling
Stress Factor A – Rock Strength HW Model
Long section view showing rock strength
Rock Stress Factor A
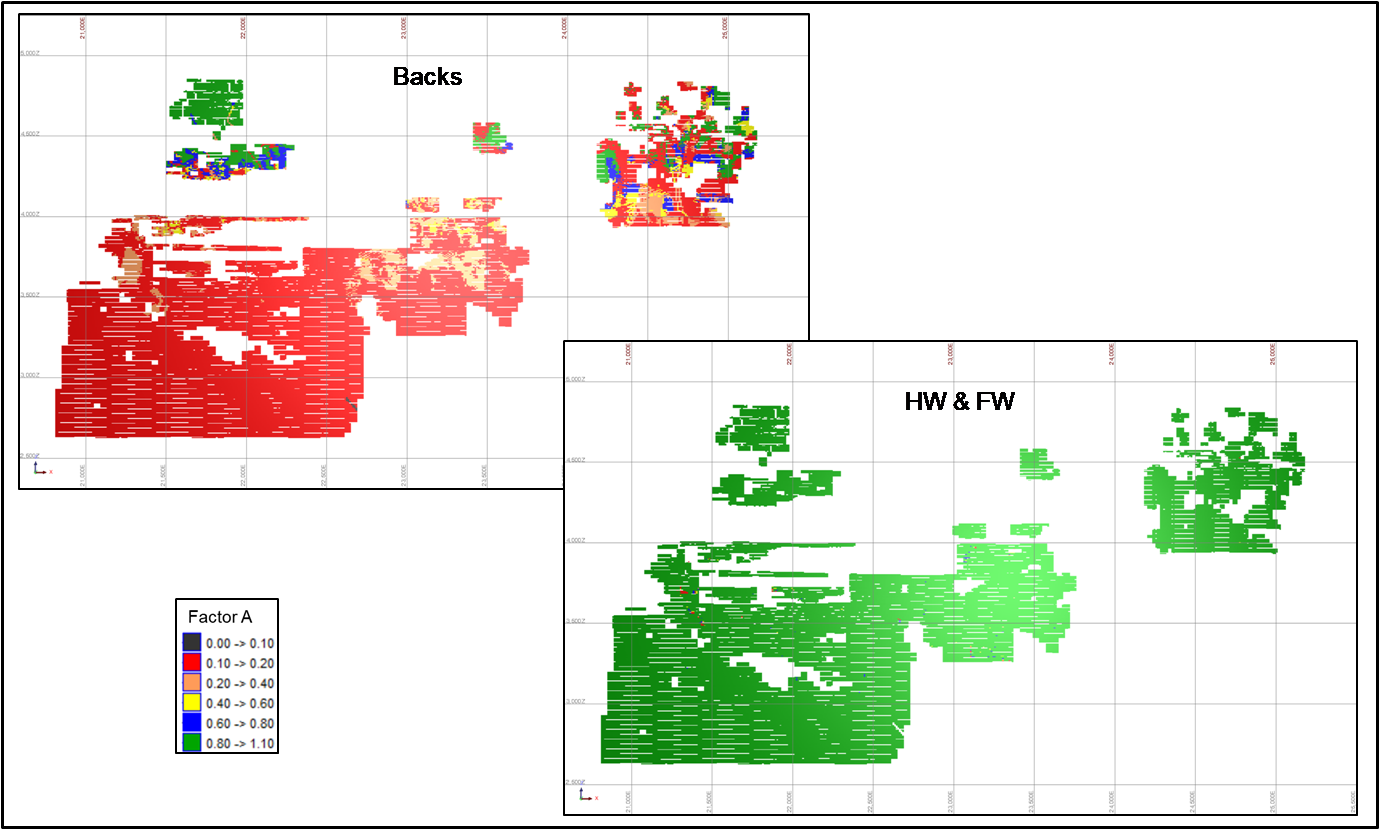
Long section view showing Factor A for the LOM stopes
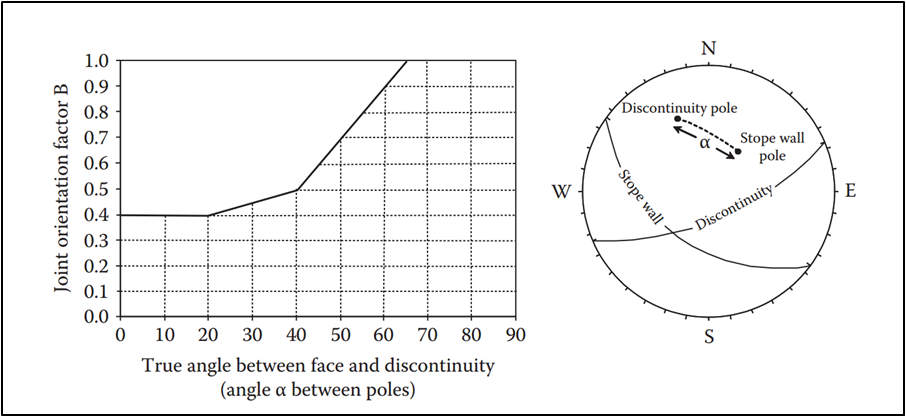
Critical Structure Orientation Factor B Model
Factor B is determined based on critical structural orientation that is considered mostly likely to detract from the stability of a particular stope surface, based on:
- In-situ structure measurements – alpha / beta from drillhole core, televiewer surveys and underground mapping data.
- Orebody wireframes
- Significant geotechnical structure wireframes
- Stope wireframes to determine the HW, FW and Back orientations.
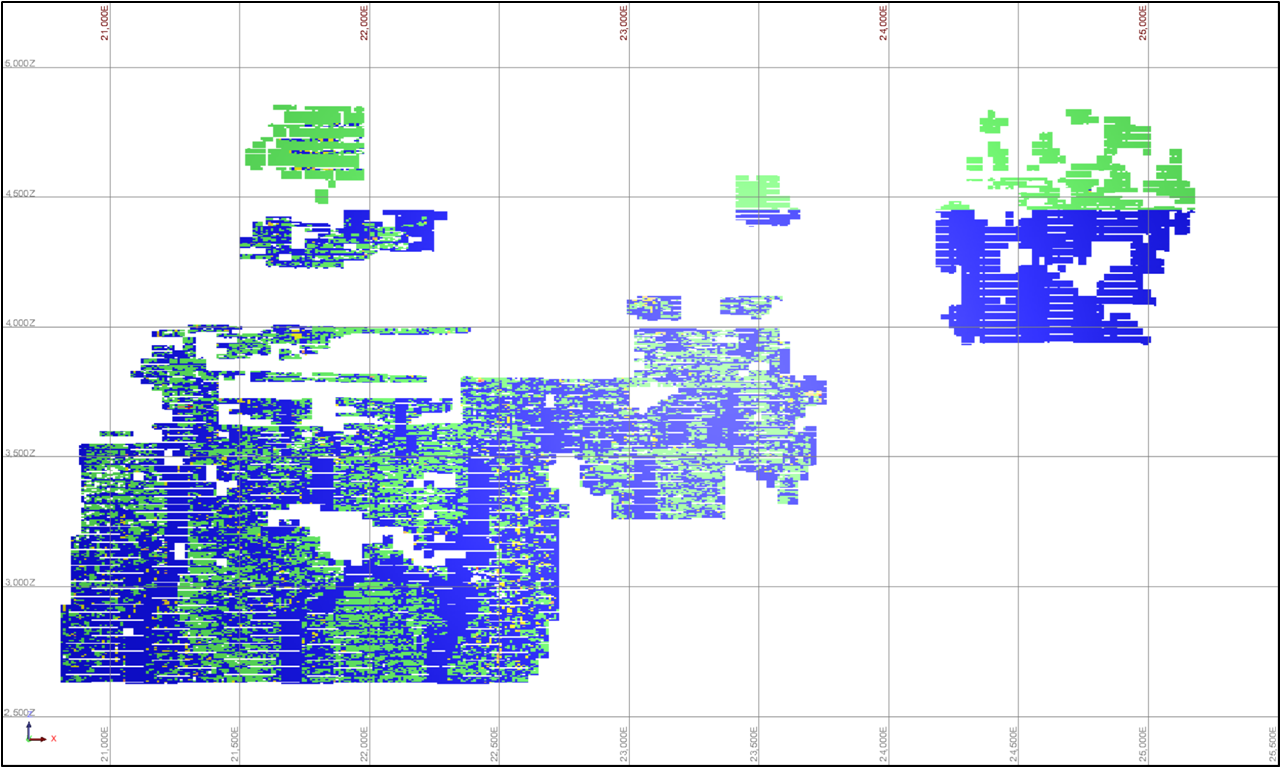
Factor B – Critical Structure Orientation
Structural domains are created based on available structural data from drillhole and underground mapping, televiewer surveys and orientations of the ore bodies and mining zones.
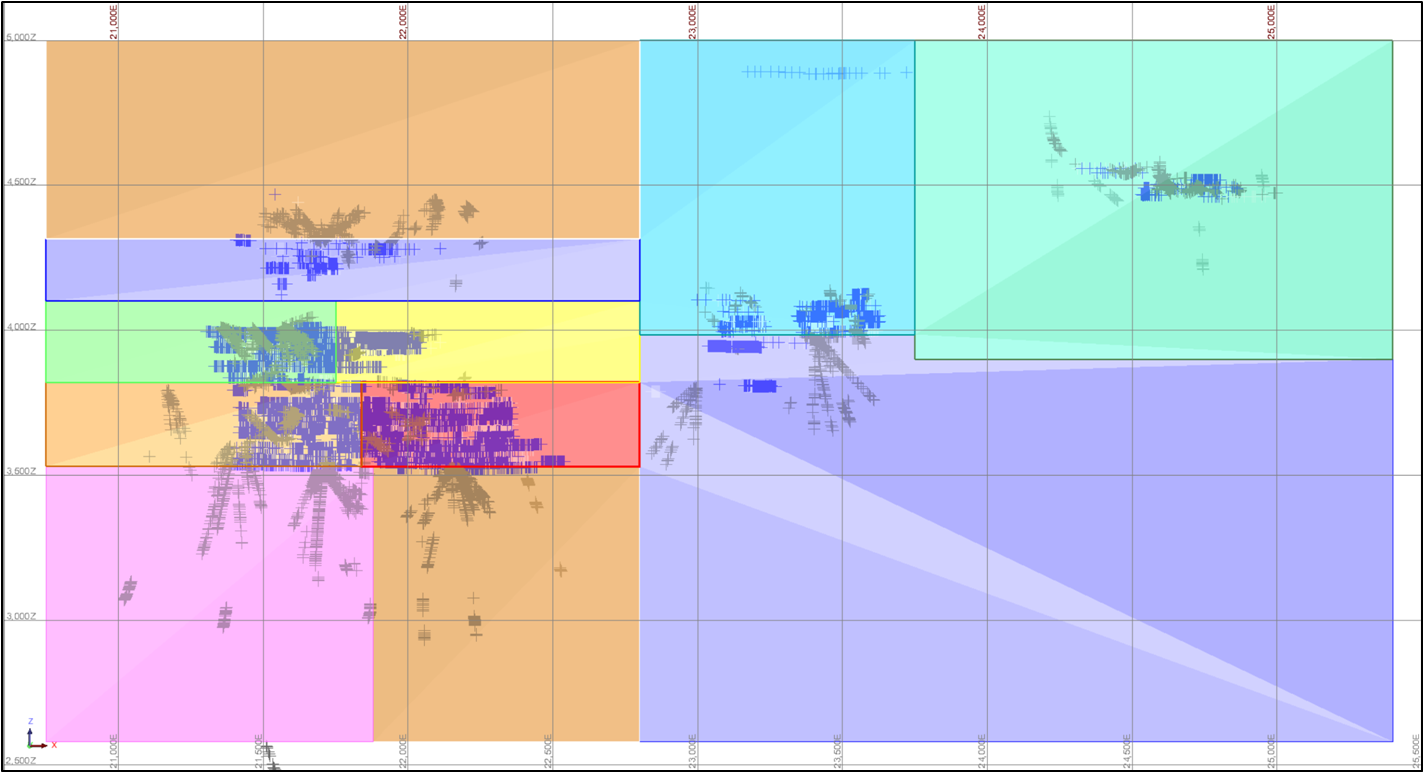
Long section view looking north showing structural domains
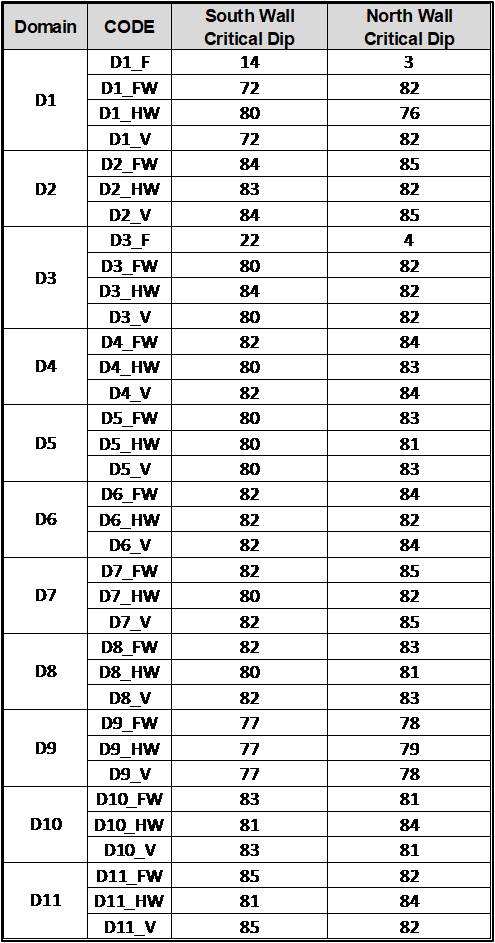
Factor B – Critical Structural Orientation
- Critical dip is determined based on the critical structural orientation and the wall conventional type
- The walls are conventionally defined by determined dip and dip direction:
- Flat (F) – dip <20deg
- HW / FW – dip 20-85deg
- North wall dipping north – HW
- North wall dipping south – FW
- South wall dipping north – FW
- South wall dipping south – HW
- Vertical (V) – dip >85deg
Factor B – Model

Long section view showing Factor B for the LOM stope FW
Gravity Factor C Model
Factor C is determined based on potential falling by gravity and slabbing in stope HW and Backs, and potential sliding by critical structure in stope FW.
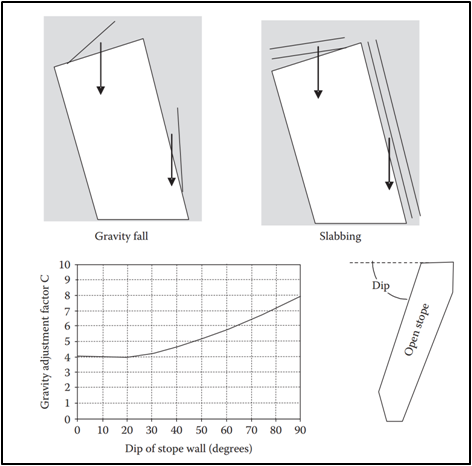
– Wall Dip = 20 – 90 C = 0.00049Dip2 + 0.0033Dip + 3.74

Joint Dip = 30 – 90 C = -0.0667Dip + 10
Factor C – Dip Model
Calculated dip and dip direction of the ore bodies HW and FW, and critical structural orientation used to determine Factor B are used to determine Factor C in conjunction the graphs for potential falling or sliding conditions.

Long section view showing Dip model
Factor C – Model

Long section view showing Factor C for the LOM stope FW
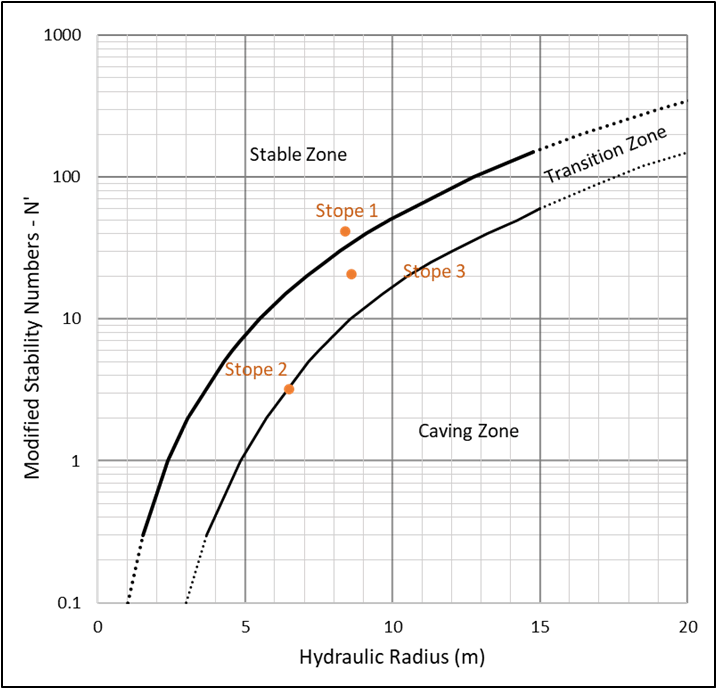
Stable HR Calculation
Based on the Stability Graph, the stable HR values are calculated for the boundary between the Stable Zone and unsupported Transition Zone.

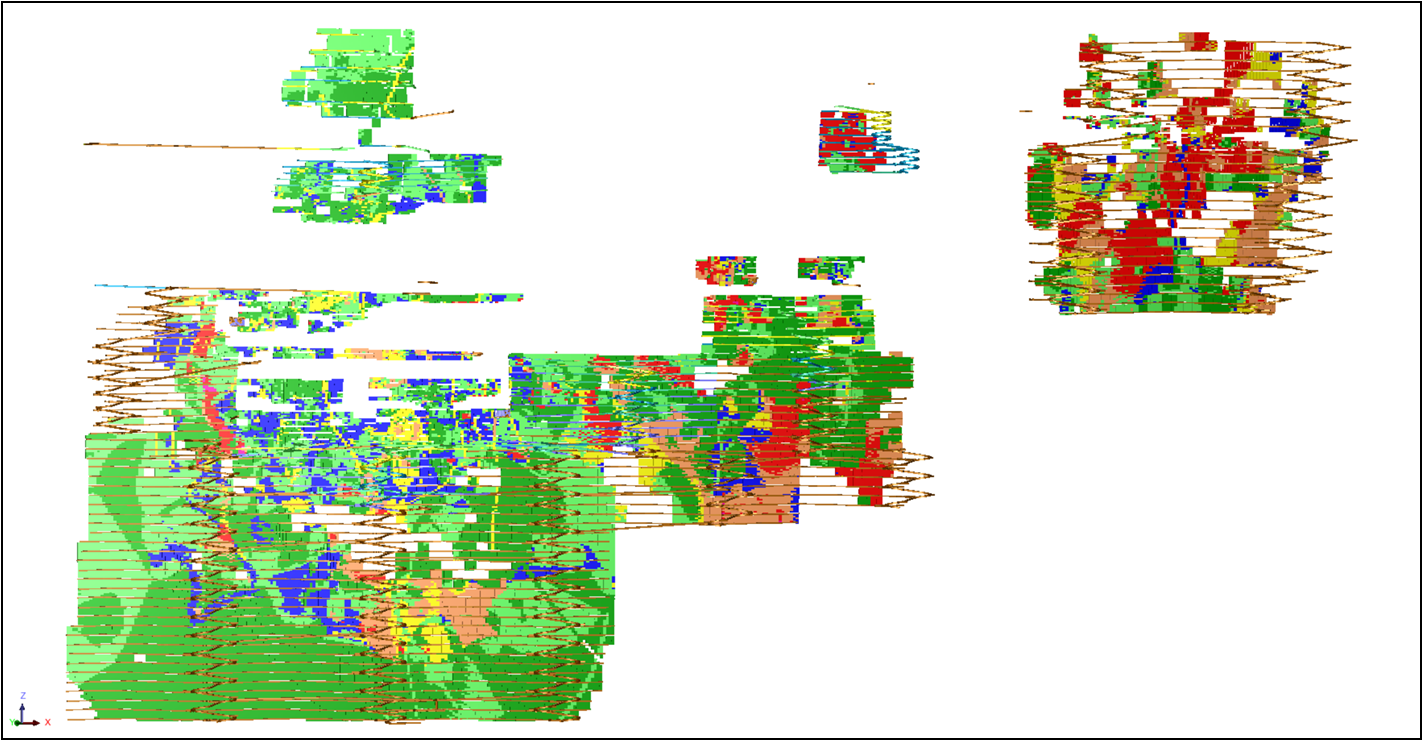
HR Model – Hangingwall
Long section view showing HR model for the LOM stope HW
HR Model – Footwall

Long section view showing HR model for the LOM stope FW
HR Model – Backs

Long section view showing HR model for the LOM stope Backs
HR Model Calibration
Examples of recent mined stopes used for model calibration
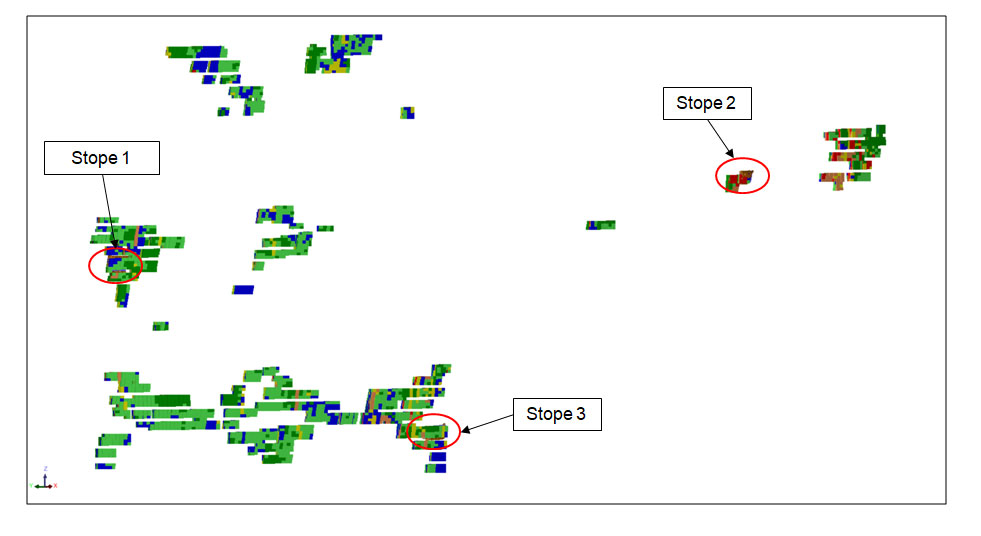
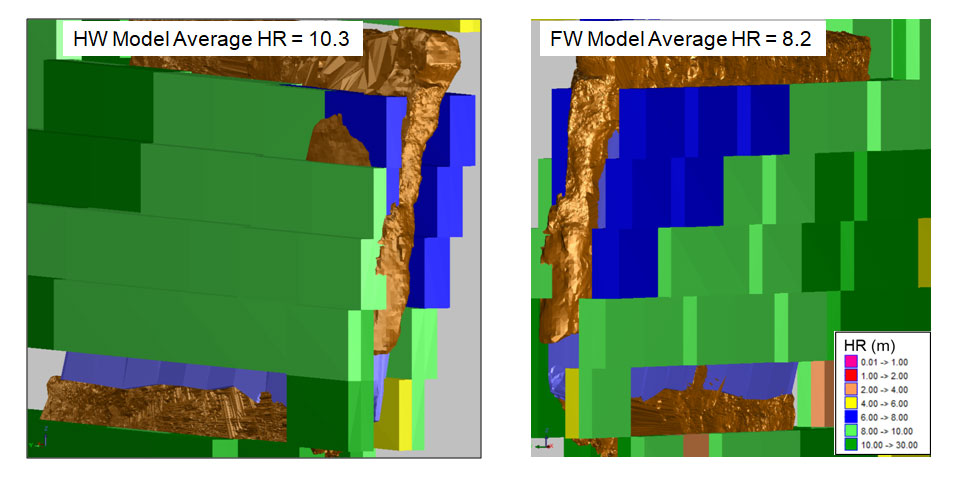
Mined HR and Model HR
Stope 1 – mined HR = 8.4
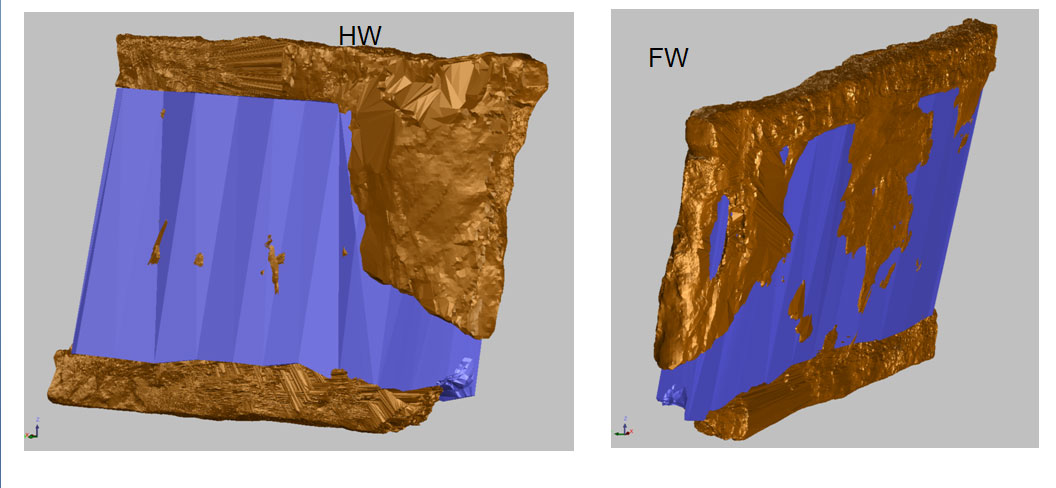
Mined HR and Model HR
Stope 1 – mined HR = 8.4
Model Average HR = 9.3
FW Model Average HR = 8.2
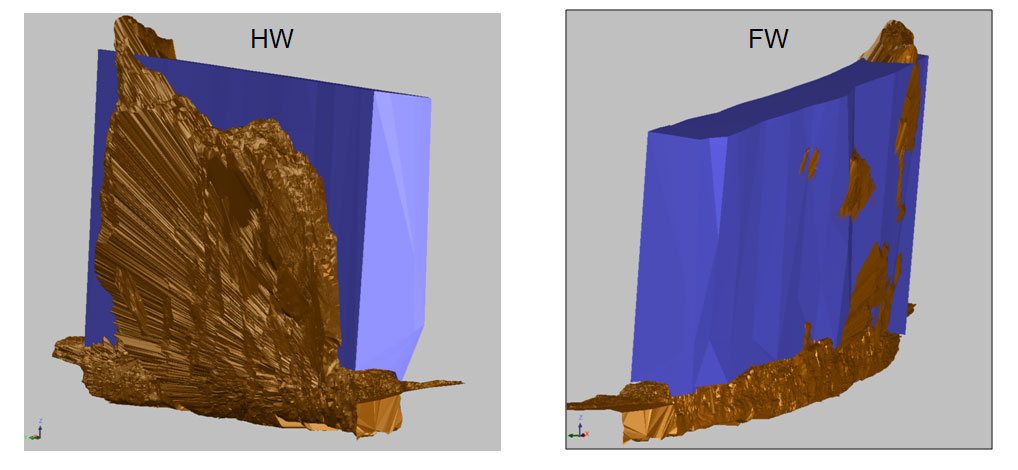
Mined HR and Model HR
Stope 2 – mined HR = 6.5

Mined HR and Model HR
Stope 2 – mined HR = 6.5
Model Average HR = 7.4
FW Model Average HR = 3.6 – should be considered in HR design

Mined HR and Model HR
Stope 3 – mined HR = 8.6
Mined HR and Model HR
Stope 3 – HR = 8.6
Model Average HR = 8.8
Foliation structure parallel to HW Average HR = 7.2
Crosscut structure Average HR = 4.7
These structures should be considered in HR design
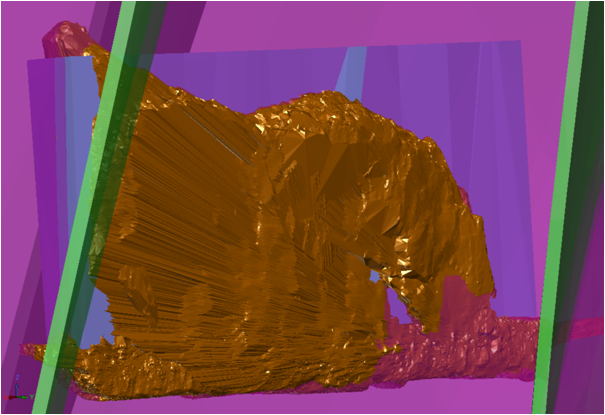
HW foliation structure (purple)
Crosscut structure (green)
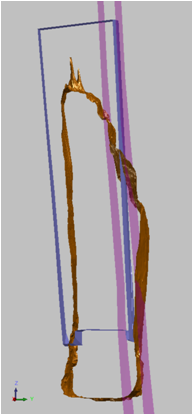
Cross section showing HW foliation structure (purple)

HW HR for the structures
HR Model Calibration
Comparison between mined and model HR on the Stability Graph:
- Stope 1 mined HR of 8.4 and Model Average HR of 9.3 (stable)
- Stope 2 mined HR of 6.5 and FW Model Average HR of 3.6 (excessive overbreak)
- Stope 3 mined HR of 8.6 and Foliation structure parallel to HW Average HR of 7.2 (overbreak due to structure)